Vector & Raster images
A raster image, also called a bitmap, is a way to represent digital
images. The raster image takes a wide variety of formats, including the
familiar .gif, .jpg, and .bmp. A raster image represents an image in a series
of bits of information which translate into pixels on the screen. These pixels
form points of colour which create an overall finished image.
When a
raster image is created, the image on the screen is converted into pixels. Each pixel is assigned a specific value which
determines its colour. The raster image system uses the red, green, blue (RGB)
colour system.
An RGB
value of 0,0,0 would be black, and the values go all the way through to 256 for
each colour, allowing the expression of a wide range of colour values. In
photographs with subtle shading, this can be extremely valuable.
When a
raster image is viewed, the pixels usually smooth out visually for the user,
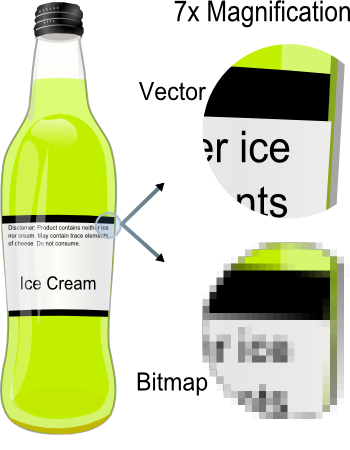
who sees a photograph or drawing. When blown up, the pixels in a raster image
become apparent. While this effect is sometimes a deliberate choice on the part
of an artist, it is usually not desired.
Depending
on resolution, some raster images can be enlarged to very large sizes, while
others quickly become difficult to see. The smaller the resolution, the smaller
the digital image file. For this reason, people who work with computer graphics must find a balance between resolution
and image size.

Vector graphics, unlike JPEGs, GIFs, and BMP
images, vector graphics are not made up of a grid of pixels. Instead, vector
graphics are comprised of paths, which are defined by a start and end point,
along with other points, curves, and angles along the way.
A path can be a line, a square, a triangle, or a curvy shape. These
paths can be used to create simple drawings or complex diagrams. Paths are even
used to define the characters of specific typefaces.
Because vector-based images are not made up of a specific number of
dots, they can be scaled to a larger size and not lose any image quality. If
you blow up a raster graphic, it will look blocky, or "pixelated."
When you blow up a vector graphic, the edges of each object within the graphic
stay smooth and clean.
Vector & raster, comparison
Vector image
Advantages :
o Data can be represented
at its original resolution and form without generalization.
o Graphic output is
usually more aesthetically pleasing (traditional cartographic representation);
o Since most data, e.g.
hard copy maps, is in vector form no data conversion is required.
o Accurate geographic
location of data is maintained.
o Allows for efficient
encoding of topology, and as a result more efficient operations that require
topological information, e.g. proximity, network analysis.
Disadvantages:
o The location of each
vertex needs to be stored explicitly.
o For effective analysis,
vector data must be converted into a topological structure. This is often
processing intensive and usually requires extensive data cleaning. As well,
topology is static, and any updating or editing of the vector data requires
re-building of the topology.
o Algorithms for
manipulative and analysis functions are complex and may be processing
intensive. Often, this inherently limits the functionality for large data sets,
e.g. a large number of features.
o Continuous data, such
as elevation data, is not effectively represented in vector form. Usually
substantial data generalization or interpolation is required for these data
layers.
o Spatial analysis and
filtering within polygons is impossible
Raster images
Advantages :
o The geographic location
of each cell is implied by its position in the cell matrix. Accordingly, other
than an origin point, e.g. bottom left corner, no geographic coordinates are
stored.
o Due to the nature of
the data storage technique data analysis is usually easy to program and quick
to perform.
o The inherent nature of
raster maps, e.g. one attribute maps, is ideally suited for mathematical
modeling and quantitative analysis.
o Discrete data, e.g.
forestry stands, is accommodated equally well as continuous data, e.g.
elevation data, and facilitates the integrating of the two data types.
o Grid-cell systems are
very compatible with raster-based output devices, e.g. electrostatic plotters,
graphic terminals.
Disadvantages:
o The cell size
determines the resolution at which the data is represented.;
o It is especially
difficult to adequately represent linear features depending on the cell
resolution. Accordingly, network linkages are difficult to establish.
o Processing of
associated attribute data may be cumbersome if large amounts of data exists.
Raster maps inherently reflect only one attribute or characteristic for an
area.
o Since most input data
is in vector form, data must undergo vector-to-raster conversion. Besides
increased processing requirements this may introduce data integrity concerns
due to generalization and choice of inappropriate cell size.
o Most output maps from
grid-cell systems do not conform to high-quality cartographic needs.

No comments:
Post a Comment