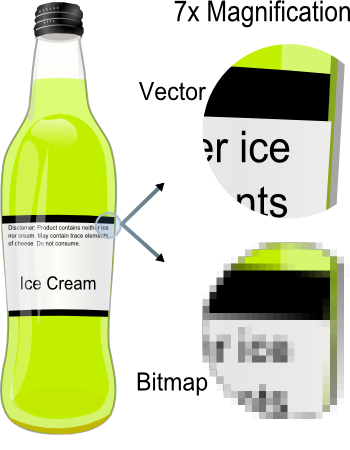
Wednesday 30 January 2013

Pixels


‘Pixel’ is short for Picture Element. When we see graphic images on digital devices the display divides the screen into thousands or millions of pixels, arranged in rows and columns. Each pixel has its own address in this grid and is represented by dots or squares.

                                                          
Pixels build up a sample of an original image and are the smallest component of a digital image. The more pixels used to represent an image, the closer it will resemble the original.

The number of pixels used to create an image is often referred to as the ‘resolution’. The best digital cameras have the highest pixel count because they produce a higher-quality image.


In colour images a pixel is typically comprised of three of four colour dots – a red, a blue and a green. When these colour dots converge, they build coloured pixels. You might have spent most of your youth playing Mario games with 256 x 224 pixels – now a typical HD monitor can display 1,366 x 768 pixels.


RGB

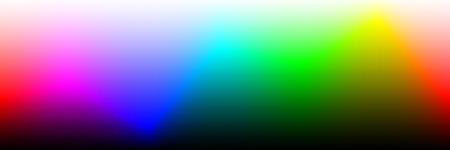
Mixing red (R), green (G), and blue (B) can produce a large part of the visible spectrum. When these three colors overlap, they produce white, and hence this is known as an additive color model.

Computer monitors produce colors by emitting light through red, green, and blue phosphors. But that only explains part of it. Your monitor settings can be customized depending on your preference and hardware such as your graphics card.

Monitors have various display settings, such as 256 colors (8 bit), high color (16 bit), or even true color (32 bit). If you’re using true color, you’ll notice a world of difference when compared to 256 colors.

You can also adjust settings like your monitor’s brightness or play with the color levels pretty easily – processors very similar to changing the brightness and color levels on your TV set. Therefore, a color on one computer can look completely different on another computer.


Colour space & YUV

A device color space simply describes the range of colors, or gamut, that a camera can see, a printer can print, or a monitor can display.

Editing color spaces, on the other hand, such as Adobe RGB or sRGB, are device-independent. They also determine a color range you can work in. Their design allows you to edit images in a controlled, consistent manner.

A device color space is tied to the idiosyncrasies of the device it describes. An editing space, on the other hand, is gray balanced — colors with equal amounts of Red, Green, and Blue appear neutral. Editing spaces also are perceptually uniform; i.e. changes to lightness, hue, or saturation are applied equally to all the colors in the image.

Colorspace is a bit unusual. The Y component determines the brightness of the color (referred to as luminance or luma), while the U and V components determine the color itself (the chroma).

Y ranges from 0 to 1 (or 0 to 255 in digital formats), while U and V range from -0.5 to 0.5 (or -128 to 127 in signed digital form, or 0 to 255 in unsigned form). Some standards further limit the ranges so the out-of-bounds values indicate special information like synchronization.

One neat aspect of YUV is that you can throw out the U and V components and get a grey-scale image. Since the human eye is more responsive to brightness than it is to color, many lossy image compression formats throw away half or more of the samples in the chroma channels to reduce the amount of data to deal with, without severely destroying the image quality.


Bit rate


Bit rate, generally the higher the bitrate the higher the image quality of the video output. Modern codecs like H.264 will look noticeably better at the same bitrate vs. older codecs like H.263, and variable bitrate (VBR) will look better than constant bitrate (CBR) in most applications.

Keep in mind, there are 8 bits in a byte. So 1 megabyte per second would be 8 megabits per second (mbps). For reference, HD Blu-ray video is generally around 20mbps, standard definition DVD around 6mbps, high-quality web video about 2 mbps, and video for phones in the kilobit range (kbps).


Explanation on bit rate


Bit Depth

Bit depth quantifies how many unique colors are available in an image's color palette in terms of the number of 0's and 1's, or "bits," which are used to specify each color.

This does not mean that the image necessarily uses all of these colors, but that it can instead specify colors with that level of precision. For a grayscale image, the bit depth quantifies how many unique shades are available. Images with higher bit depths can encode more shades or colors since there are more combinations of 0's and 1's available.

Every color pixel in a digital image is created through some combination of the three primary colors: red, green, and blue. Each primary color is often referred to as a "color channel" and can have any range of intensity values specified by its bit depth.

The bit depth for each primary color is termed the "bits per channel." The "bits per pixel" (bpp) refers to the sum of the bits in all three color channels and represents the total colors available at each pixel. Confusion arises frequently with color images because it may be unclear whether a posted number refers to the bits per pixel or bits per channel. Using "bpp" as a suffix helps distinguish these two terms.


Most color images from digital cameras have 8-bits per channel and so they can use a total of eight 0's and 1's. This allows for 28 or 256 different combinations—translating into 256 different intensity values for each primary color. When all three primary colors are combined at each pixel, this allows for as many as 28*3 or 16,777,216 different colors, or "true color." This is referred to as 24 bits per pixel since each pixel is composed of three 8-bit color channels. The number of colors available for any X-bit image is just 2X if X refers to the bits per pixel and 23X if X refers to the bits per channel.


24 bbp


16 bbp


8 bbp

The difference between 24 bpp and 16 bpp is subtle, but will be clearly visible if you have your display set to true color or higher (24 or 32 bpp).

The following table illustrates different image types in terms of bits (bit depth), total colors available, and common names.

Bits Per Pixel
Number of Colors Available
Common Name(s)
1
2
Monochrome
2
4
CGA
4
16
EGA
8
256
VGA
16
65536
XGA, High Color
24
16777216
SVGA, True Color
32
16777216 + Transparency
48
281 Trillion


Resolution

Resolution refers to the sharpness and clarity of an image. The term is most often used to describe monitors, printers, and bit-mapped graphic images.
                                     
For graphics monitors, the screen resolution signifies the number of dots (pixels) on the entire screen. For example, a 640-by-480 pixel screen is capable of displaying 640 distinct dots on each of 480 lines, or about 300,000 pixels. This translates into different dpi measurements depending on the size of the screen. For example, a 15-inch VGA monitor (640x480) displays about 50 dots per inch.


Vector & Raster images

A raster image, also called a bitmap, is a way to represent digital images. The raster image takes a wide variety of formats, including the familiar .gif, .jpg, and .bmp. A raster image represents an image in a series of bits of information which translate into pixels on the screen. These pixels form points of colour which create an overall finished image.
                                            
When a raster image is created, the image on the screen is converted into pixels. Each pixel is assigned a specific value which determines its colour. The raster image system uses the red, green, blue (RGB) colour system.

An RGB value of 0,0,0 would be black, and the values go all the way through to 256 for each colour, allowing the expression of a wide range of colour values. In photographs with subtle shading, this can be extremely valuable.

When a raster image is viewed, the pixels usually smooth out visually for the user, who sees a photograph or drawing. When blown up, the pixels in a raster image become apparent. While this effect is sometimes a deliberate choice on the part of an artist, it is usually not desired.

Depending on resolution, some raster images can be enlarged to very large sizes, while others quickly become difficult to see. The smaller the resolution, the smaller the digital image file. For this reason, people who work with computer graphics must find a balance between resolution and image size.


Vector graphics, unlike JPEGs, GIFs, and BMP images, vector graphics are not made up of a grid of pixels. Instead, vector graphics are comprised of paths, which are defined by a start and end point, along with other points, curves, and angles along the way.

A path can be a line, a square, a triangle, or a curvy shape. These paths can be used to create simple drawings or complex diagrams. Paths are even used to define the characters of specific typefaces.

Because vector-based images are not made up of a specific number of dots, they can be scaled to a larger size and not lose any image quality. If you blow up a raster graphic, it will look blocky, or "pixelated." When you blow up a vector graphic, the edges of each object within the graphic stay smooth and clean.

Vector & raster, comparison

Vector image

Advantages :

o   Data can be represented at its original resolution and form without generalization.
o   Graphic output is usually more aesthetically pleasing (traditional cartographic representation);
o   Since most data, e.g. hard copy maps, is in vector form no data conversion is required.
o   Accurate geographic location of data is maintained.
o   Allows for efficient encoding of topology, and as a result more efficient operations that require topological information, e.g. proximity, network analysis.

Disadvantages:

o   The location of each vertex needs to be stored explicitly.
o   For effective analysis, vector data must be converted into a topological structure. This is often processing intensive and usually requires extensive data cleaning. As well, topology is static, and any updating or editing of the vector data requires re-building of the topology.
o   Algorithms for manipulative and analysis functions are complex and may be processing intensive. Often, this inherently limits the functionality for large data sets, e.g. a large number of features.
o   Continuous data, such as elevation data, is not effectively represented in vector form. Usually substantial data generalization or interpolation is required for these data layers.
o   Spatial analysis and filtering within polygons is impossible


Raster images

Advantages :

o   The geographic location of each cell is implied by its position in the cell matrix. Accordingly, other than an origin point, e.g. bottom left corner, no geographic coordinates are stored.
o   Due to the nature of the data storage technique data analysis is usually easy to program and quick to perform.
o   The inherent nature of raster maps, e.g. one attribute maps, is ideally suited for mathematical modeling and quantitative analysis.
o   Discrete data, e.g. forestry stands, is accommodated equally well as continuous data, e.g. elevation data, and facilitates the integrating of the two data types.
o   Grid-cell systems are very compatible with raster-based output devices, e.g. electrostatic plotters, graphic terminals.

Disadvantages:

o   The cell size determines the resolution at which the data is represented.;
o   It is especially difficult to adequately represent linear features depending on the cell resolution. Accordingly, network linkages are difficult to establish.
o   Processing of associated attribute data may be cumbersome if large amounts of data exists. Raster maps inherently reflect only one attribute or characteristic for an area.
o   Since most input data is in vector form, data must undergo vector-to-raster conversion. Besides increased processing requirements this may introduce data integrity concerns due to generalization and choice of inappropriate cell size.
o   Most output maps from grid-cell systems do not conform to high-quality cartographic needs.